
What does a Housing Association do? initial attempt at an Open model
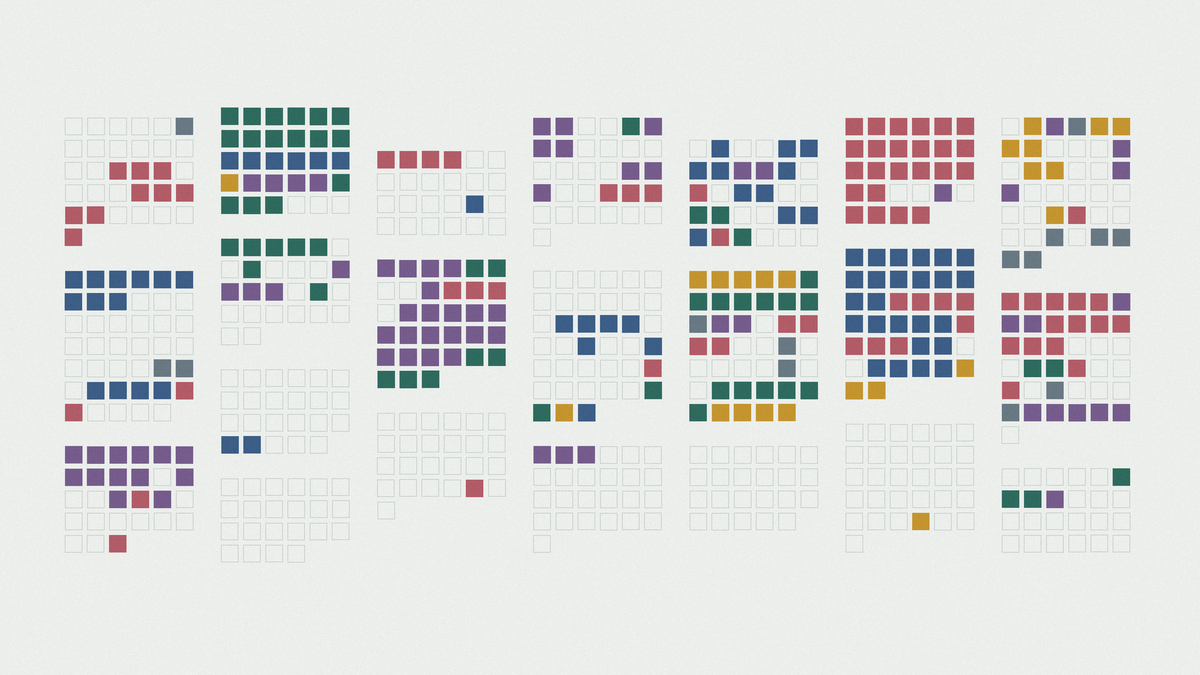
What does a housing association actually do? Here's my map. Help me fix it.
An open model of social housing: the services residents use, and the 667 activities behind them. Free for anyone to use.
Earlier this month Rannoch Associates published a thoughtful paper on the impact of AI on housing associations. To do the analysis, they took a complete housing association operating model, broke it down into 22 service areas, 173 services and 643 individual activities, and assessed each one.
They didn't publish the model itself.
That's entirely fair. It's their work, and models like that take real effort to build. But reading the paper, I kept wanting to see it. What are the 643 things? Where does damp and mould sit? Is "complaints" one service or five?
So I built my own version. Then I asked Dave Skinner to give it a once over, and I iterated on the feedback.
And I'm giving it away.
Version one: the view from inside
My first attempt was a map of the work, organised the way housing associations organise themselves. Repairs, Income, Lettings, Compliance. Each broken into smaller parts, all the way down to single tasks like "Monitor against Awaab's Law timescales".
I built it from the things every English provider has to do: the consumer standards, the landlord safety duties, the Building Safety Act, Awaab's Law, the Complaint Handling Code, the Tenant Satisfaction Measures. On top of that, I used how the sector usually organises its teams and costs.
I was quite pleased with it.
Then I shared it with Dave Skinner, a service designer who has spent a lot of time thinking about how housing services look to residents. He said something like this:
No one rings for the allocations service. They call to rent a home.
Fair point. And quite a big one.
Inside out vs outside in
What I'd called "services" were really how the organisation divides up its work. Useful, but it's the view from the inside. A resident doesn't experience "Lettings & Allocations". They experience trying to rent a home.
The GOV.UK Service Manual puts it well: a service is something that helps someone do something, named the way they'd say it. "Learn to drive." "Start a business." Not "Driver Licensing Directorate".
Dave had already done a lot of this thinking. His social housing service list, written a few years ago, names housing services the way residents would: "Repair my home", "End my tenancy", "Get help with my finances". It also tags each one with an interaction pattern (Apply, Book, Pay, Request, Tell or Check), building on TPXImpact's work on local government services.
So the new version has both views, linked together.
What it looks like now
Outside in: 41 services. 30 for residents, communities and businesses, and 11 for colleagues. Each is broken into the requests people actually make. "Repair my home" includes "Repair damp and mould" (Book), "Report an emergency repair" (Tell) and "Pay for a repair I'm responsible for" (Pay).
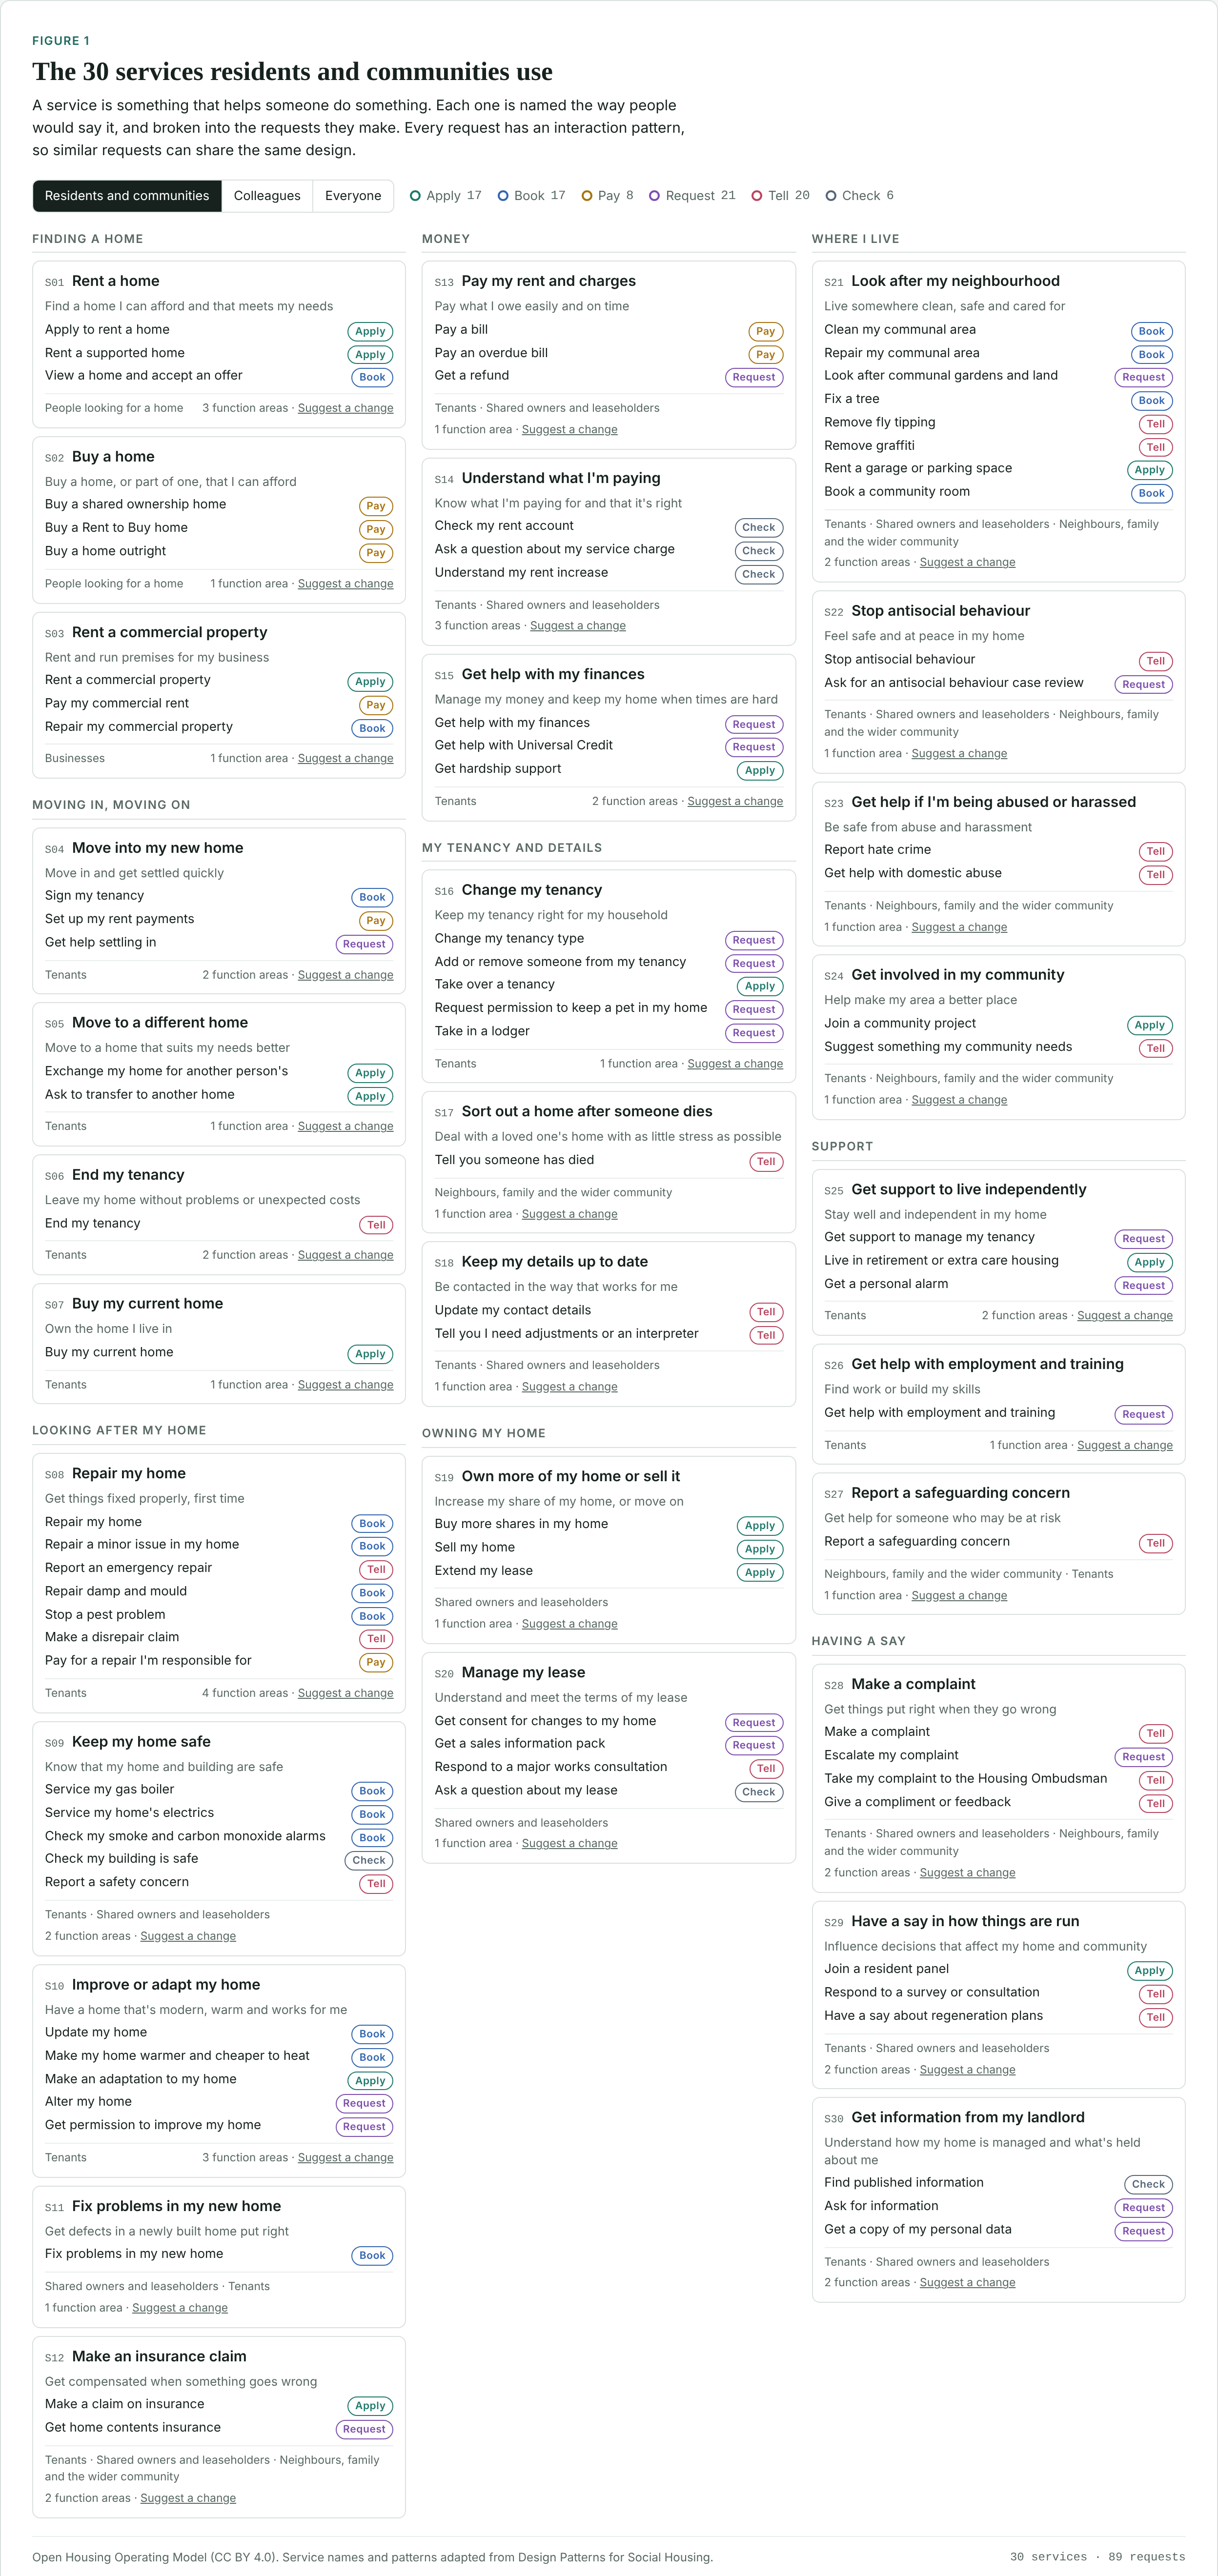
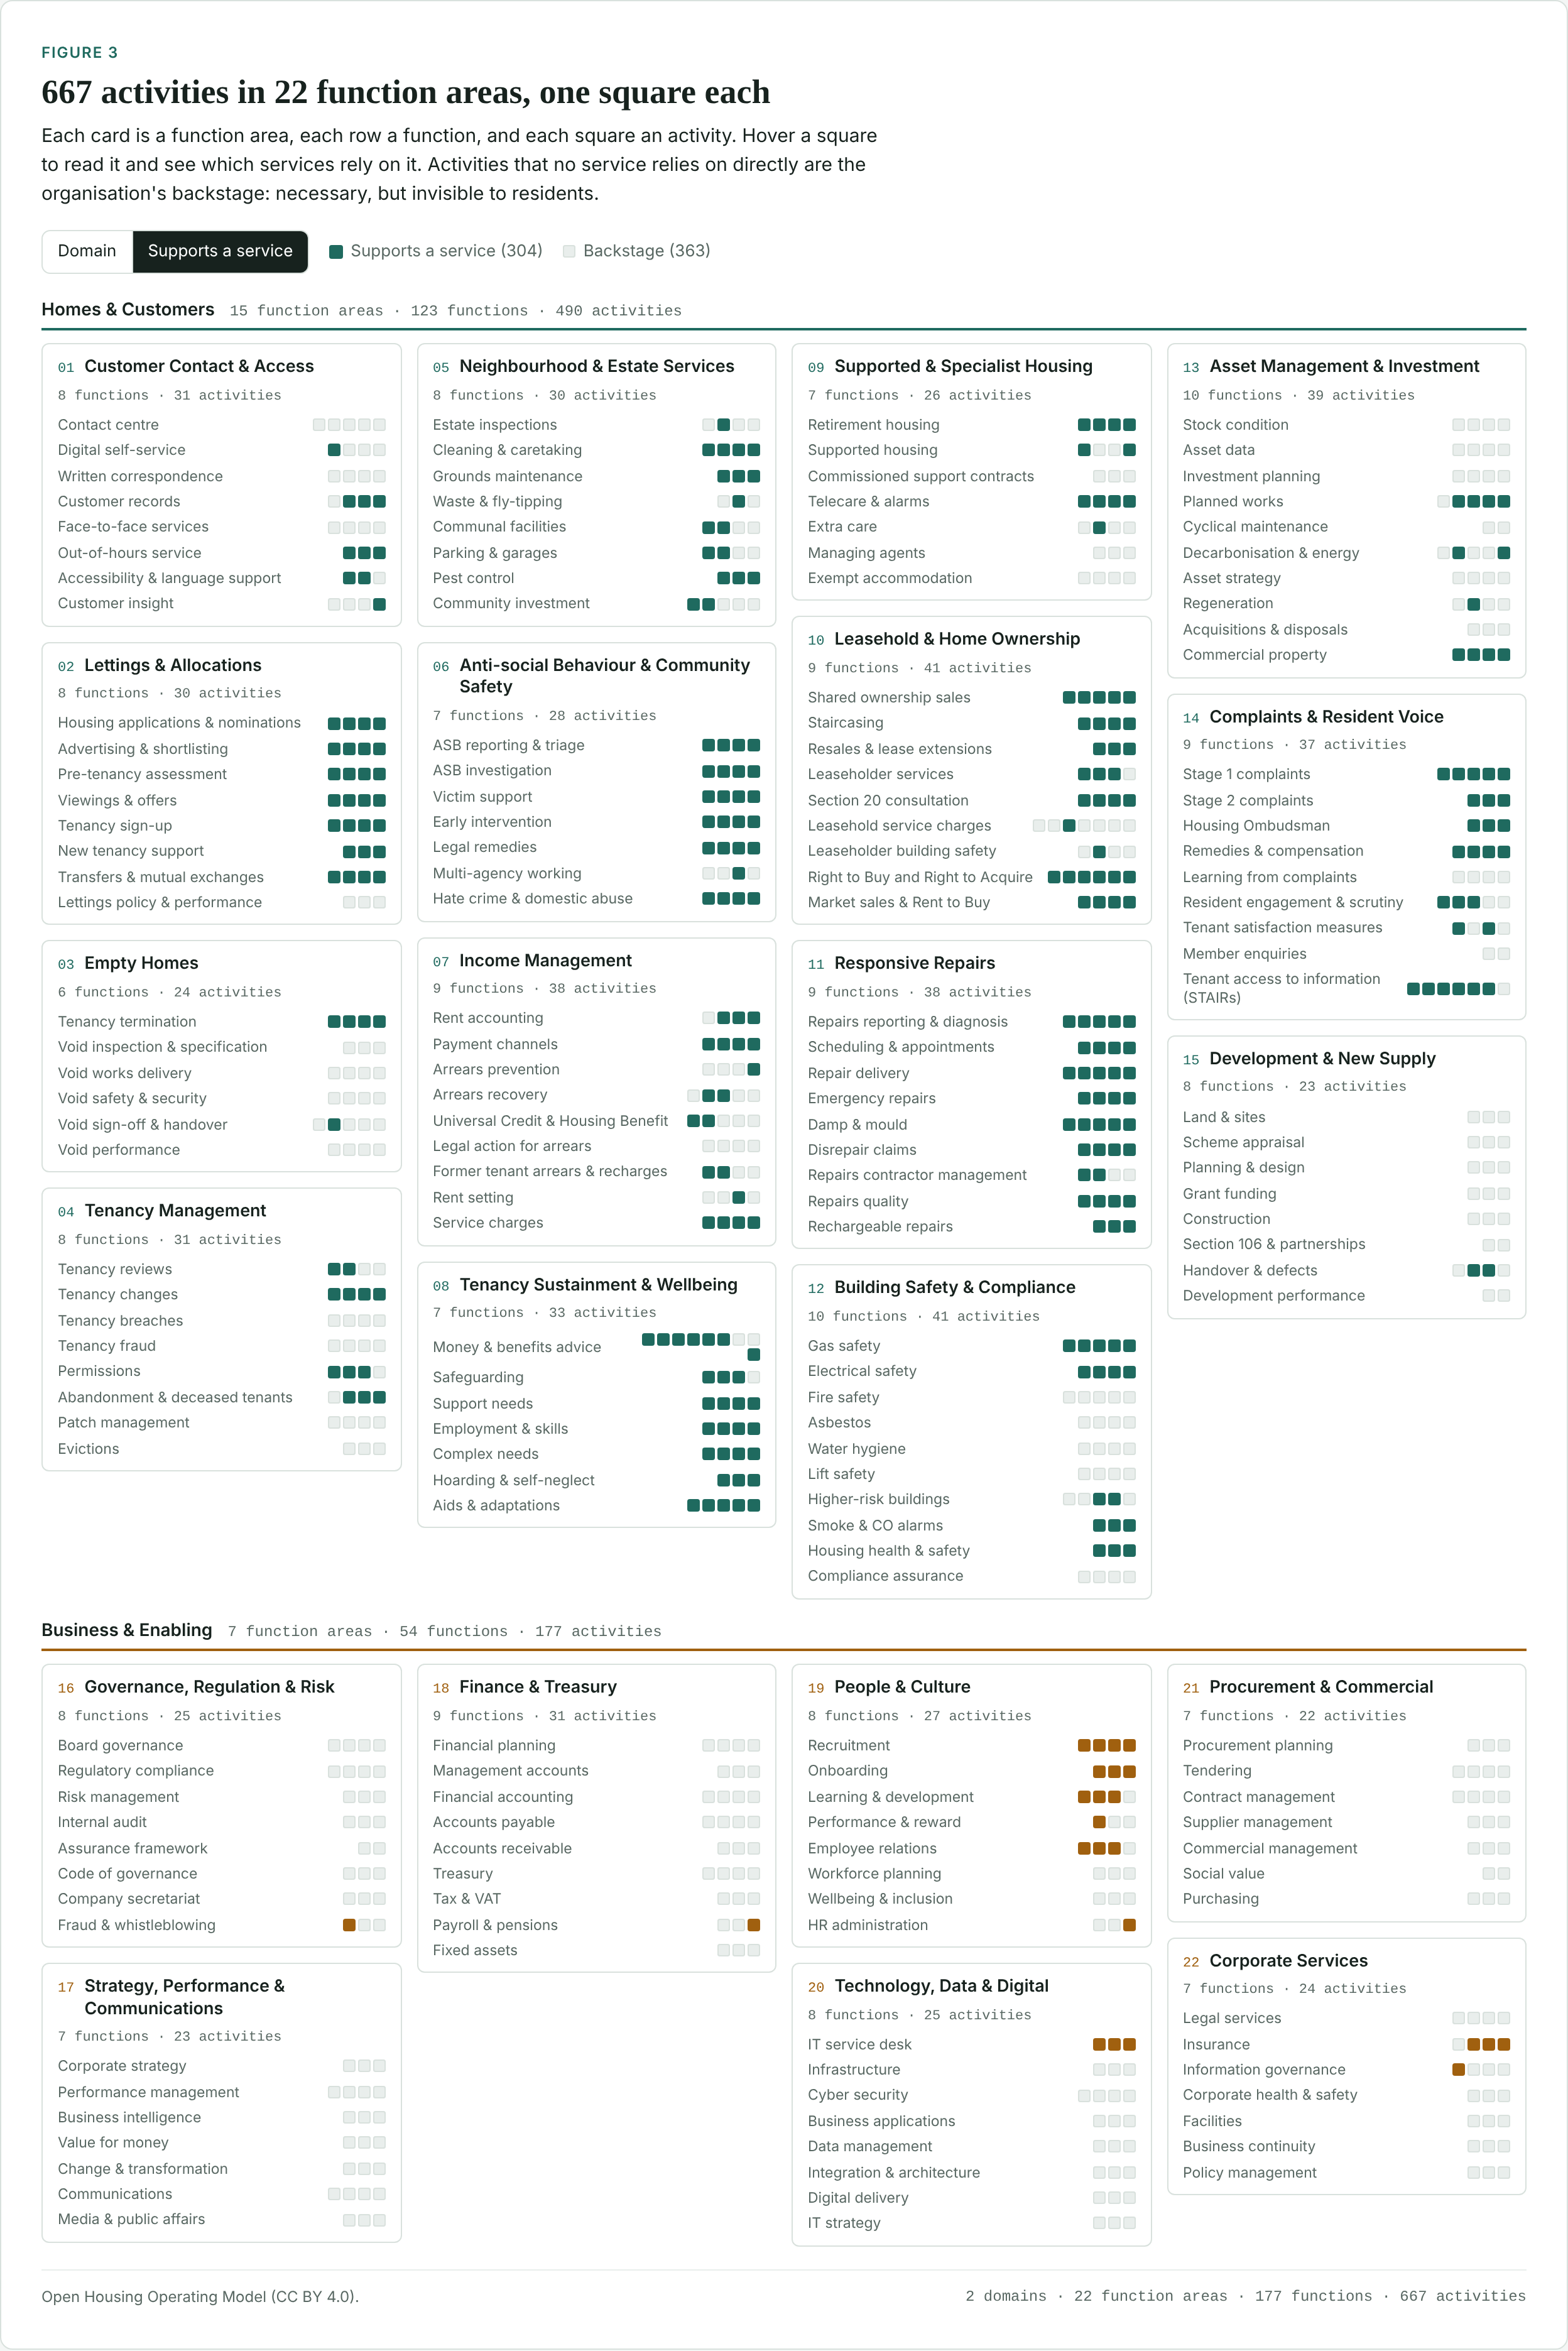
Inside out: 22 function areas, 177 functions and 667 activities. This is my original service map, but lets call it what it is: the Housing Association operating model behind the services.
Every request is linked to the activities it relies on. That's where it gets interesting.
Pull a thread
The part I've enjoyed most is tracing a single service all the way down.
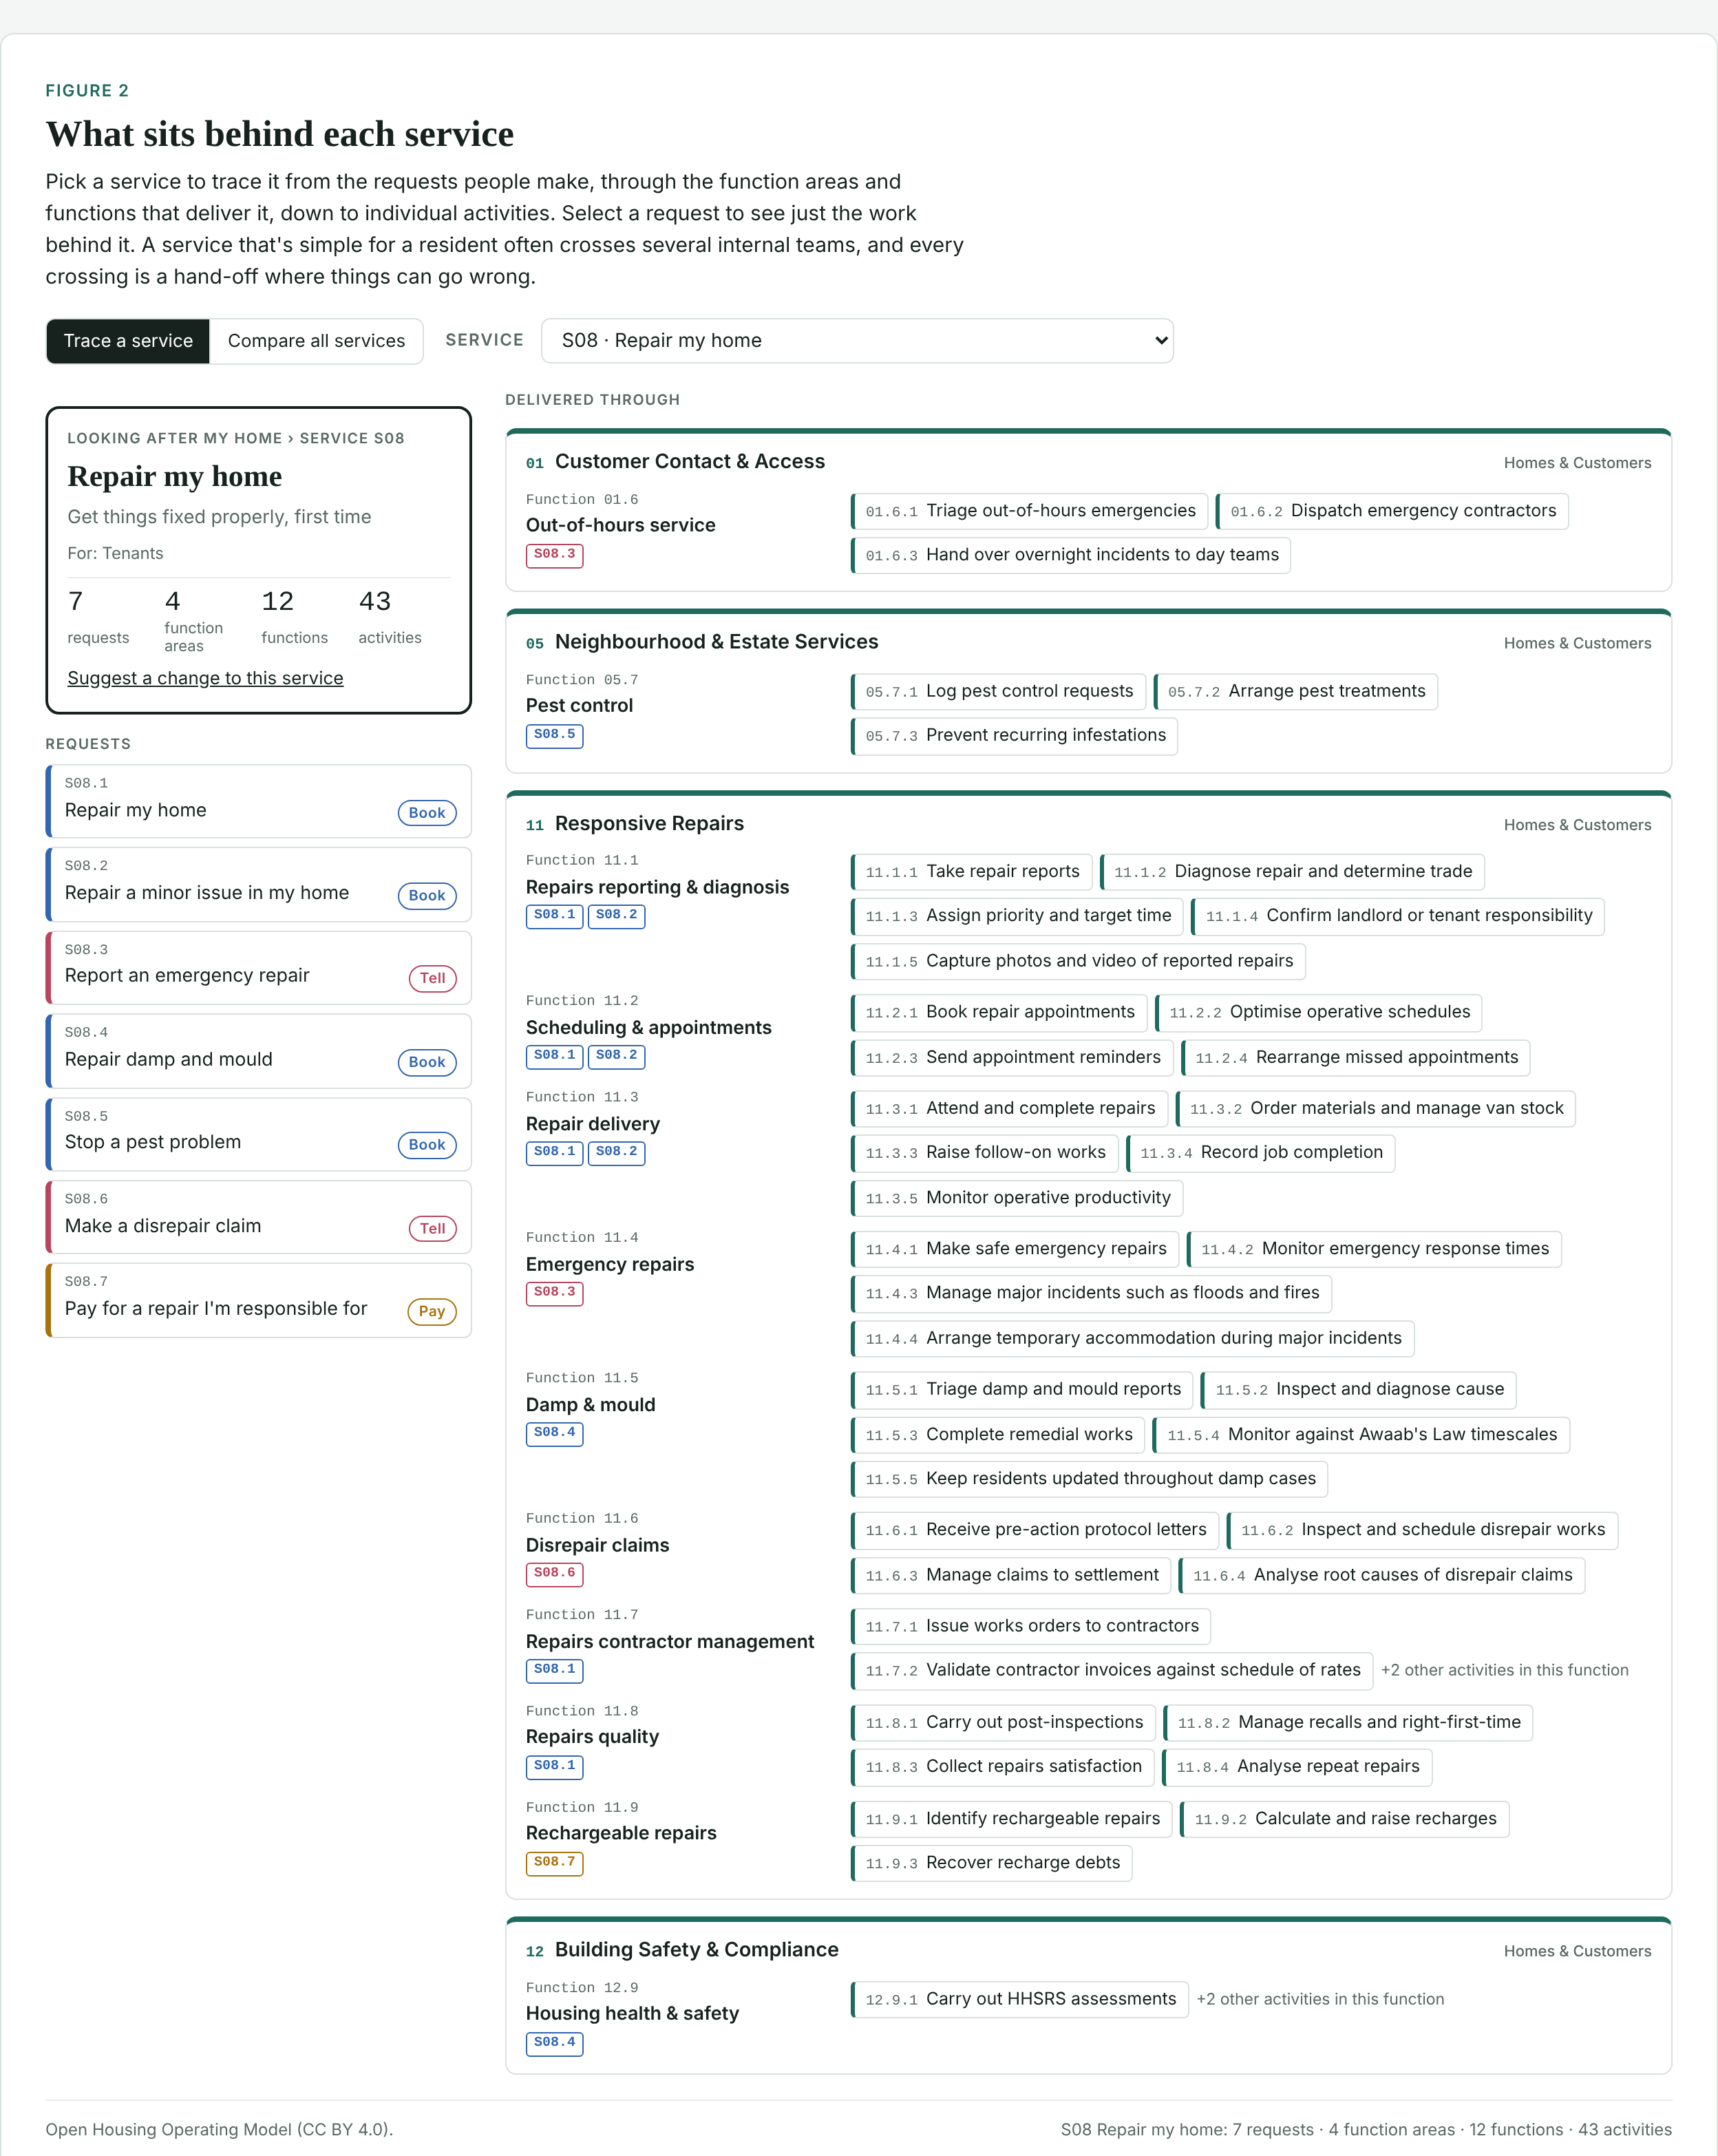
Pick "Repair my home" in the atlas and you see what sits behind it. Seven requests. Four function areas: contact, neighbourhood services, repairs and compliance. Twelve functions. Forty-three activities.
Then pick one request. Select "Repair damp and mould" and everything else fades away. What's left is the damp and mould function, its five activities, and a housing health and safety assessment from a different team.
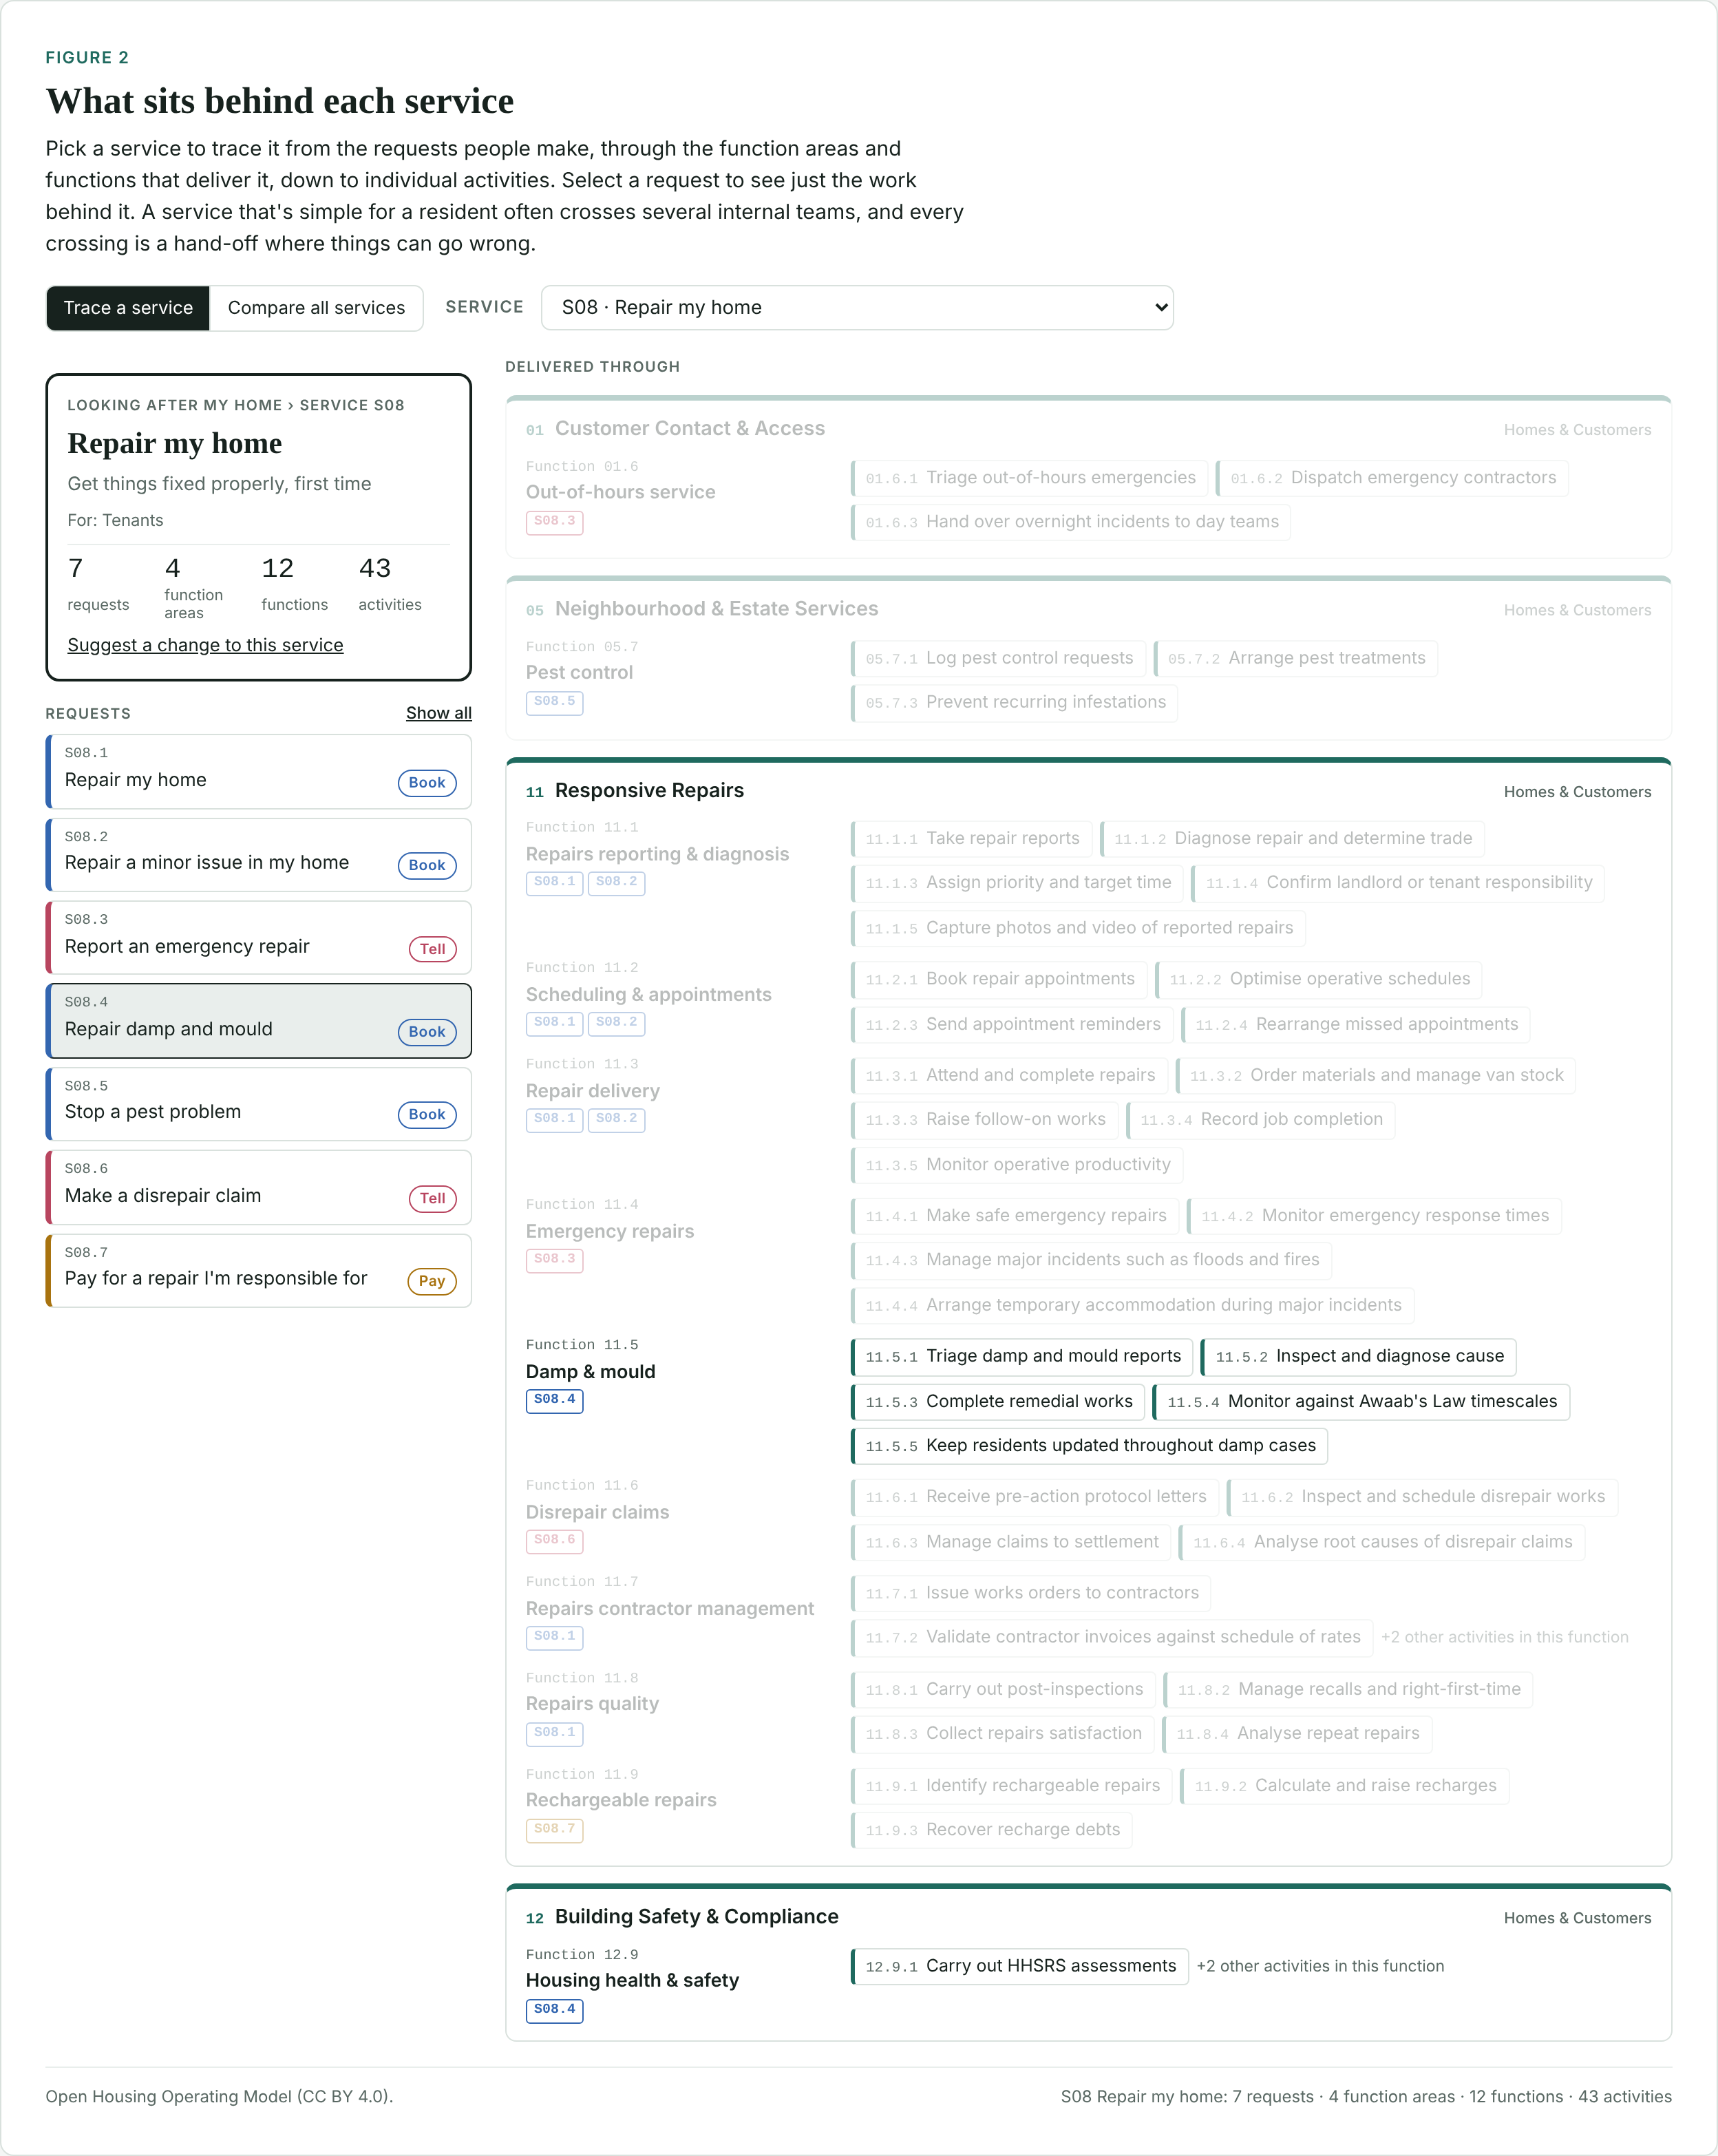
It's a simple idea, but it changes the conversation. Instead of "how do we improve repairs?", you can ask "what has to go right, and who has to do it, when someone reports mould?"
You can try it with any service.
Three things the two views show
1. Simple services cross internal boundaries. "Rent a home" is one thing to a resident. Behind it sit lettings, empty homes and supported housing. "Repair my home" crosses four function areas. Every crossing is a hand-off. And hand-offs are where residents get passed around.
2. Most of the organisation is backstage. Of the 667 activities, 304 directly support something a resident or colleague comes to do. The other 363 are backstage: governance, finance, strategy, procurement, much of asset management. They're necessary, but invisible to the people the organisation exists to serve. That's not a criticism. It's just worth seeing.
3. Patterns repeat. Dave Skinner's work around service patterns identified this early on. Booking a repair, a gas service, a communal clean and a tree visit are all "Book". Antisocial behaviour, fly tipping, safeguarding concerns and complaints are all "Tell". Design each pattern well once, and you improve dozens of services. If you're building digital services or buying a platform, that's a far better unit to work with than 40 separate journeys.
Comparing the two lists also showed gaps in my original model. Right to Buy, Rent to Buy, outright sales and commercial property were all missing. They're in now. So is STAIRs, the new tenant right to information that started this month.
Why bother?
Because the sector describes its work in a hundred slightly different ways.
Every transformation programme, system procurement and restructure starts by rebuilding some version of this map from scratch. Usually in a spreadsheet. Usually by consultants. Usually never seen again.
That's a lot of duplicated effort for a sector that doesn't compete for customers. As Rannoch point out themselves, housing associations can collaborate on this in a way most industries can't.
A shared map is useful for:
- Service design: what do residents actually come to us to do, and what sits behind it?
- Choosing systems: which requests and activities does this product actually support?
- AI and automation: where could it help, request by request, rather than in vague headlines? Just like the work that Rannoch have done
- Restructures and benchmarking: comparing like with like
What it isn't
It isn't finished, and it isn't right. Not yet.
Every name and grouping is a judgement about a generic association. Specialist providers would draw it differently. And the service names haven't been tested with residents yet, which is the most important gap of all.
The links between services and activities are also only the direct ones. "Repair my home" also depends on procurement, contractor payments and data. Mapping those hidden dependencies is exactly the kind of thing I'd love help with.
Which is where you come in.
How you can help
It's all published on GitHub under a Creative Commons licence (CC BY 4.0). You can use it, adapt it and build on it, including commercially, as long as you give credit.
More importantly, you can change it. And you don't need to know anything about GitHub to do so.
1. Have a look. The interactive atlas shows every service and every activity. Trace any service to see what sits behind it. You can download it all as a spreadsheet if you really want to.
2. Tell me what's wrong. Every service and function area on the atlas has a "Suggest a change" link that opens a short form. Something missing, misnamed or in the wrong place? Say what and why. I'll make the updates. If you've never used GitHub, there's a step-by-step guide that takes about five minutes.
3. Join the bigger conversation. For larger ideas, such as a Scottish version, services for councils and contractors, or new layers on top, use Discussions.
4. Edit it directly. If you're comfortable with GitHub, the services and each function area are simple text files. Propose a change and it's checked automatically.
The help I'd value most:
- Residents, and people who work with them. Are these the words you'd use? What's missing?
- Anyone with contact-reason data. The top 20 reasons people ring you is the best evidence of what residents think your services are.
- People who do the work. Repairs, income, lettings, ASB, compliance. You'll spot missing activities in seconds.
- Anyone outside England, or in a specialist provider, to tell me what's different.
Every accepted change gets credited, and the model is published in versions with a changelog. You'll be able to see how it evolves, and cite a fixed version if you use it.
A first credible map
Rannoch's paper ends by saying a first credible map is worth more than a more polished answer produced in private. I agree. This version exists because Dave looked at version one and told me what was wrong with it.
That's the whole idea. It's public, it's free, and with some help it can get a lot better.
Have a look, and tell me where I'm wrong.
In a future post I'll use the model to do what Rannoch did: look request by request at where AI is likely to help, and where it isn't.