
Three new tools for the Open Housing Operating Model
From map to tools: putting the open housing operating model to work
Three new tools built on the open housing operating model. Find the building blocks worth building once, see where change and opportunity collide, and assess your own organisation or a product against the model.
A map is useful. But after the last couple of posts, the question I kept asking myself was a practical one: "This is great, but what do I do with it?"
A model of what a housing association does is only worth something if it helps people make decisions. Where to invest. What to build. Where things are likely to go wrong.
So I asked myself who actually uses something like this, and what they'd want from it.
- Someone leading digital transformation wants to know what to build, and in what order.
- Someone setting strategy wants to know where the pressure is coming from.
- Someone designing an operating model wants to know where they're strong, and where they're not.
- Someone selling, or buying, a housing system wants to know what it actually covers.
That gave me three new tools. They sit alongside the atlas, with their own pages, and each one says who it's for and how to use it.
Tool 1: Patterns and components
For digital transformation teams, product owners, service designers and architects.
Every one of the 117 requests in the model follows one of six interaction patterns, adapted from Dave Skinner's Design Patterns for Social Housing. People apply for things, book things, pay for things, request things, tell you things and check things.
That's a useful way to see an organisation that's usually organised by department. For example:
- "Tell" appears in 18 different services. Reporting a repair, a death, a change of income and antisocial behaviour are all the same shape of interaction.
- "Book" appears 19 times across 9 services.
If you design one really good way to tell your landlord something, it works across most of the organisation.
Patterns only get you so far, though. The real reuse is in the building blocks underneath. So I've added a list of 15 shared components to the model and linked each request to the ones it needs.
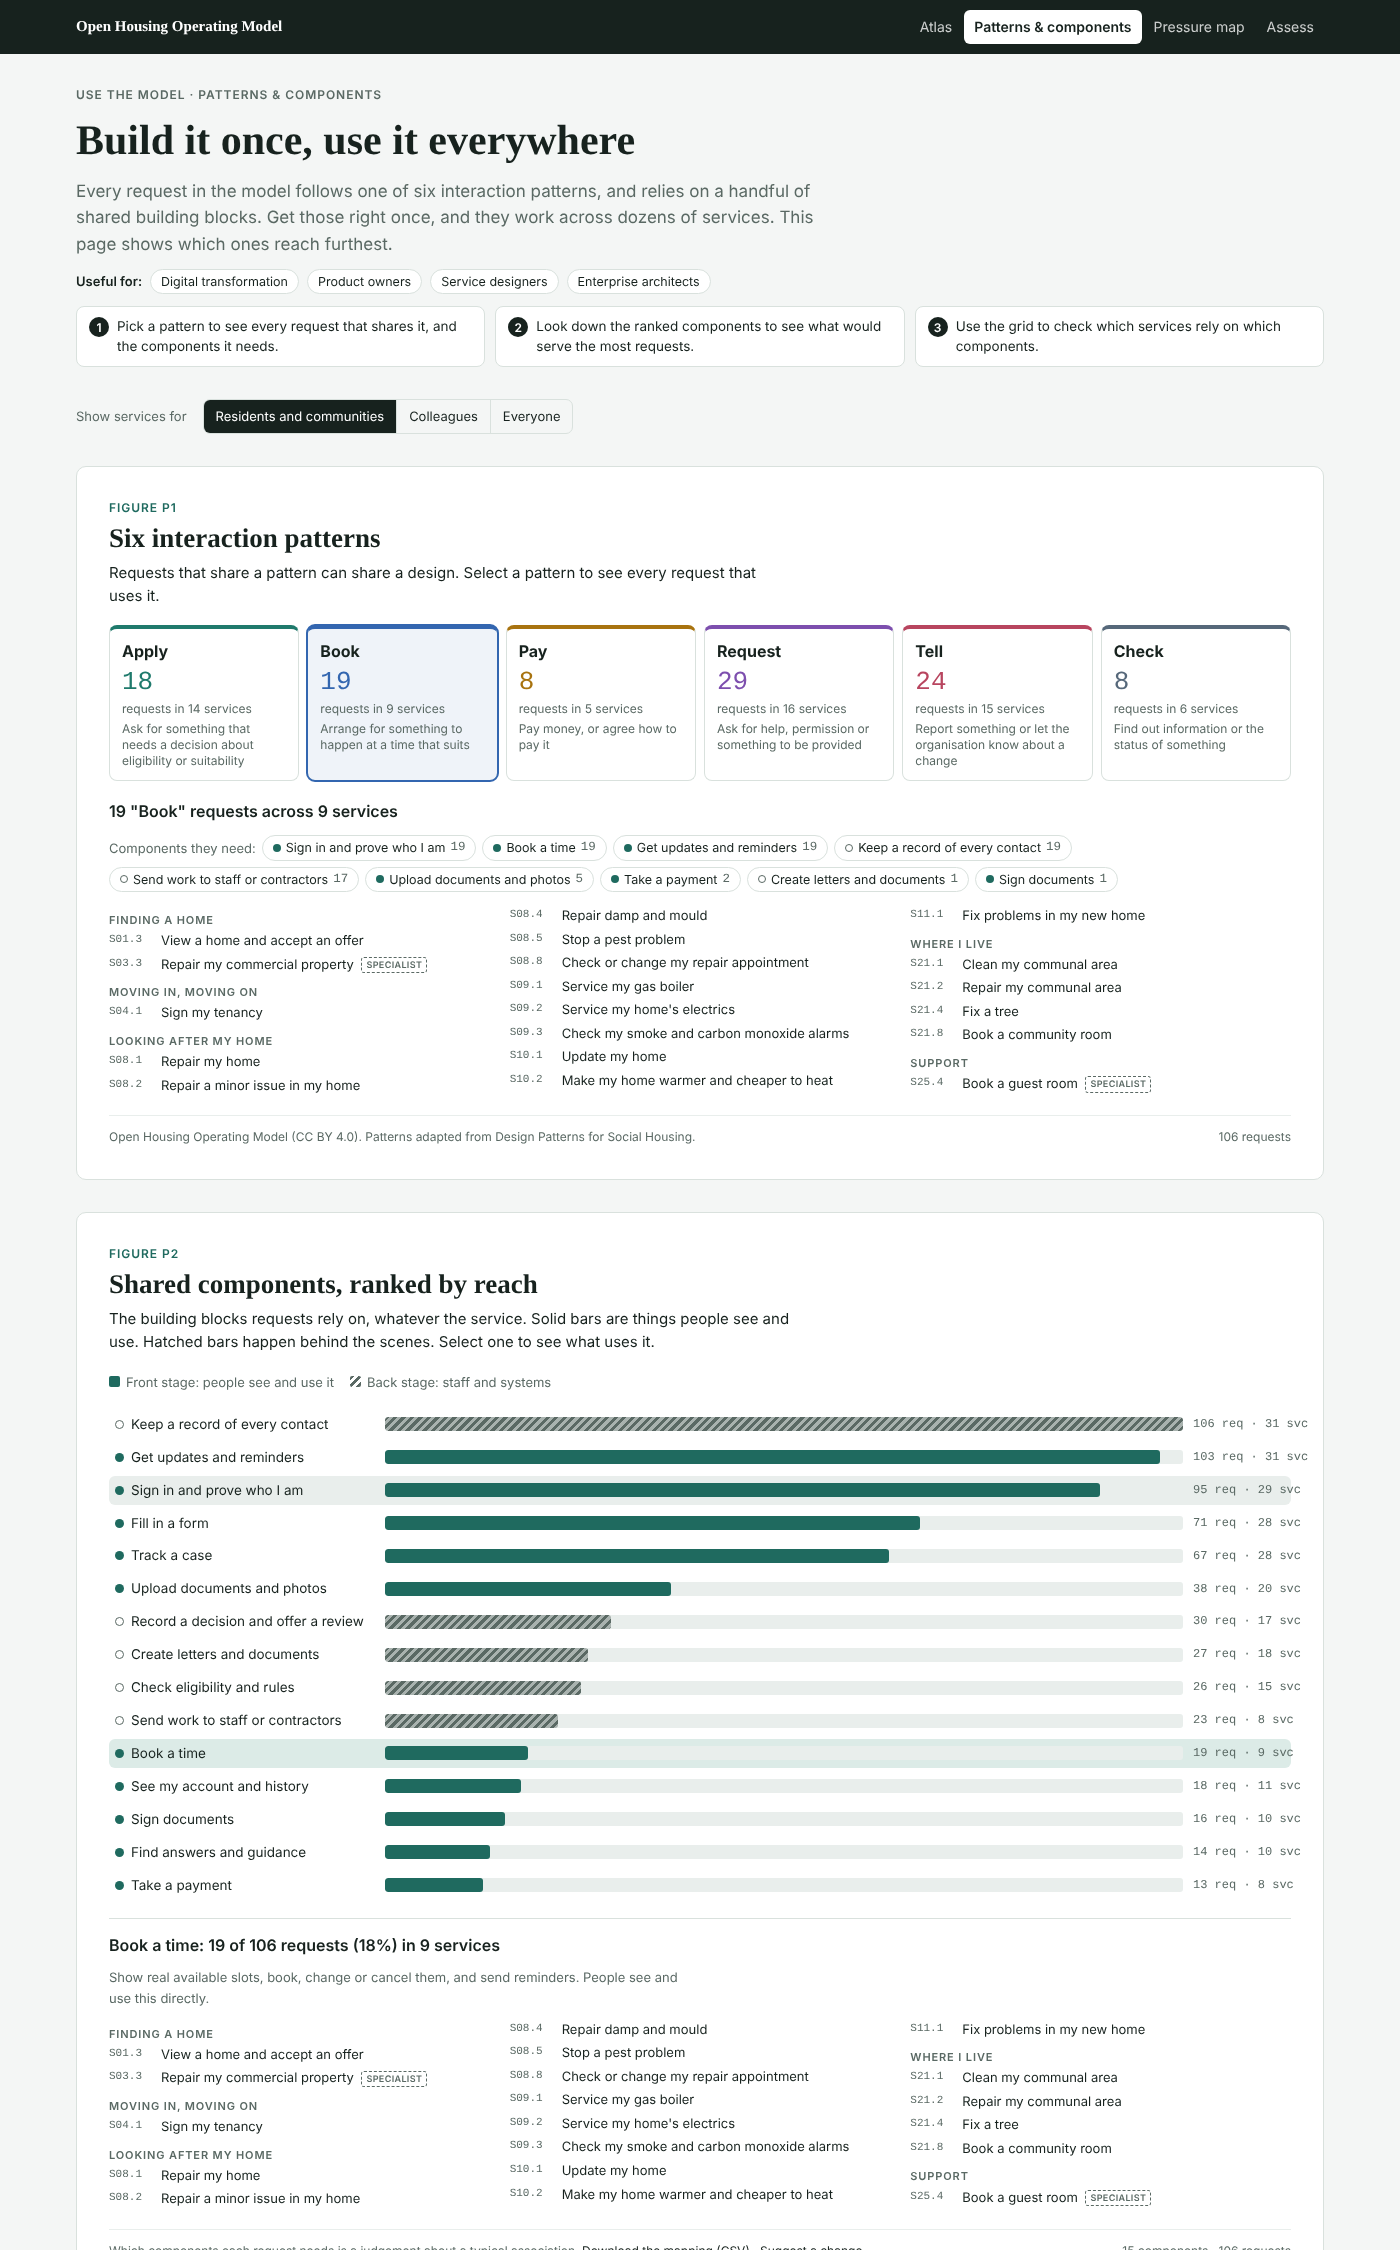
Ranked by reach, the top of the list is:
- Keep a record of every contact: all 117 requests
- Get updates and reminders: 114 requests
- Sign in and prove who I am: 105 requests
- Fill in a form: 81 requests
- Track a case: 77 requests
And towards the bottom:
- Book a time: 19 requests
- Take a payment: 14 requests
That ordering is important. Housing technology conversations often start with the specialist things, like repairs scheduling or rent accounting. Those matter. But the components that touch almost everything are the unglamorous ones: one record of every contact, telling people what's happening without them having to chase, and letting them see where their case has got to.
Get those right and most services get better at once. Get them wrong and no amount of specialist software will fix the experience.
A grid shows which services use which components, so you can see which services would benefit from each one.
Tool 2: The pressure map
For strategy and executive teams, transformation portfolios and compliance leads.
The last post introduced two optional layers: where AI could change the work, and which laws and standards require it. The pressure map puts them on the same chart.
Each bubble is a function area, sized by its number of activities:
- Up means more of its work faces regulatory change in the next 12 months.
- Right means more of it could change with AI.
The top-right corner, shaded, is where both pressures are above average.
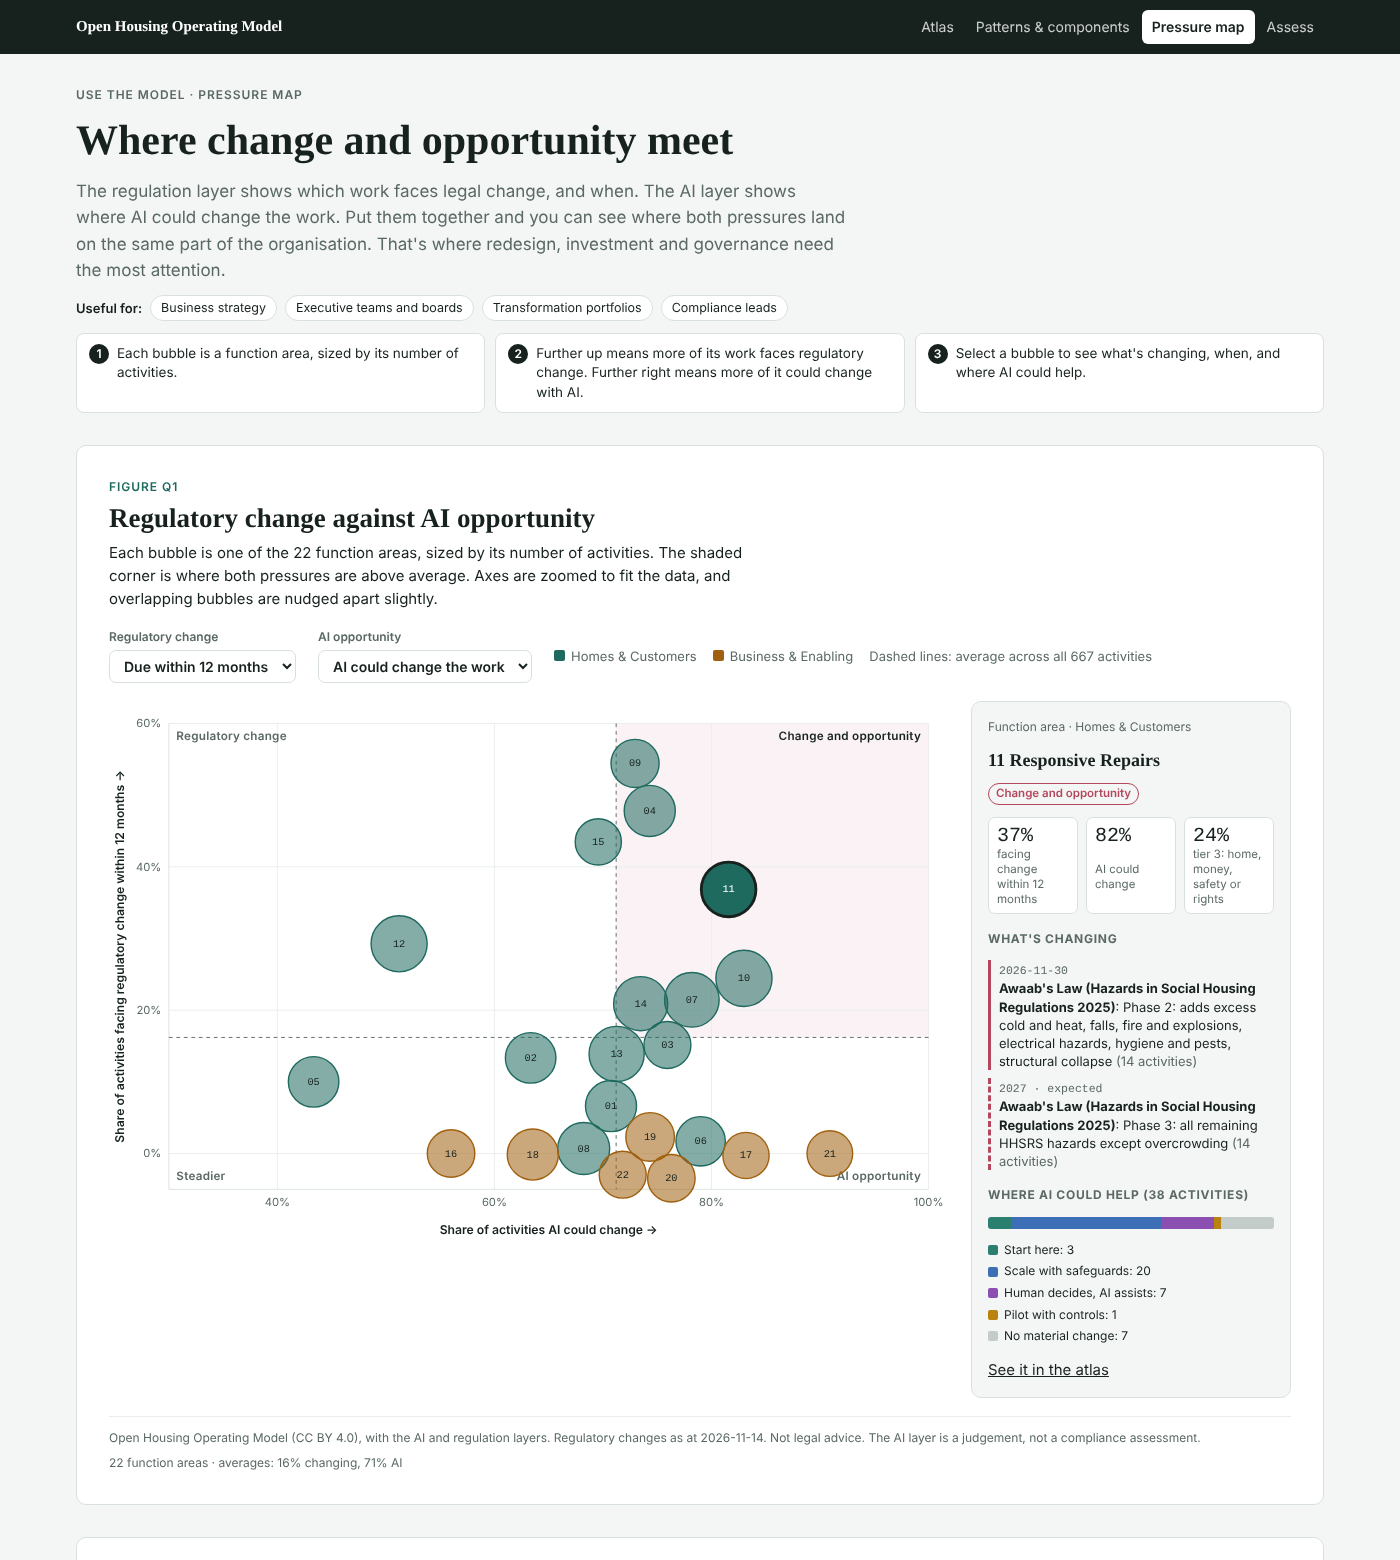
The areas in that corner:
- Responsive repairs
- Tenancy management
- Supported and specialist housing
- Leasehold and home ownership
- Income management
- Empty homes
- Complaints and resident voice
None of that is a shock. But it's useful to see it laid out, because it changes the question. If you're redesigning repairs for Awaab's Law phase 2 anyway, that's the moment to decide where AI fits, and how it's governed. Doing it as two separate projects means doing the work twice.
The one I found most interesting is just outside the corner. Building safety and compliance faces plenty of regulatory change, but only about half its work could change with AI. Of the areas that deal directly with homes and residents, only neighbourhood and estate services is lower. That feels right. When the stakes are safety-critical, the answer is more often good data and good inspection than automation.
Select any area to see exactly what's changing and when, and where AI could help. There's also a sortable table that goes down to individual functions.
Tool 3: Assess
For operating model and change teams, and for suppliers, buyers and IT teams.
This one has two modes.
Your organisation's capability. Rate each function from "not in place" to "leading". Rate whole functions for a quick picture, or open one up and rate its activities. Add notes as you go.
A product's coverage. Mark what a system supports, partly supports or doesn't support.
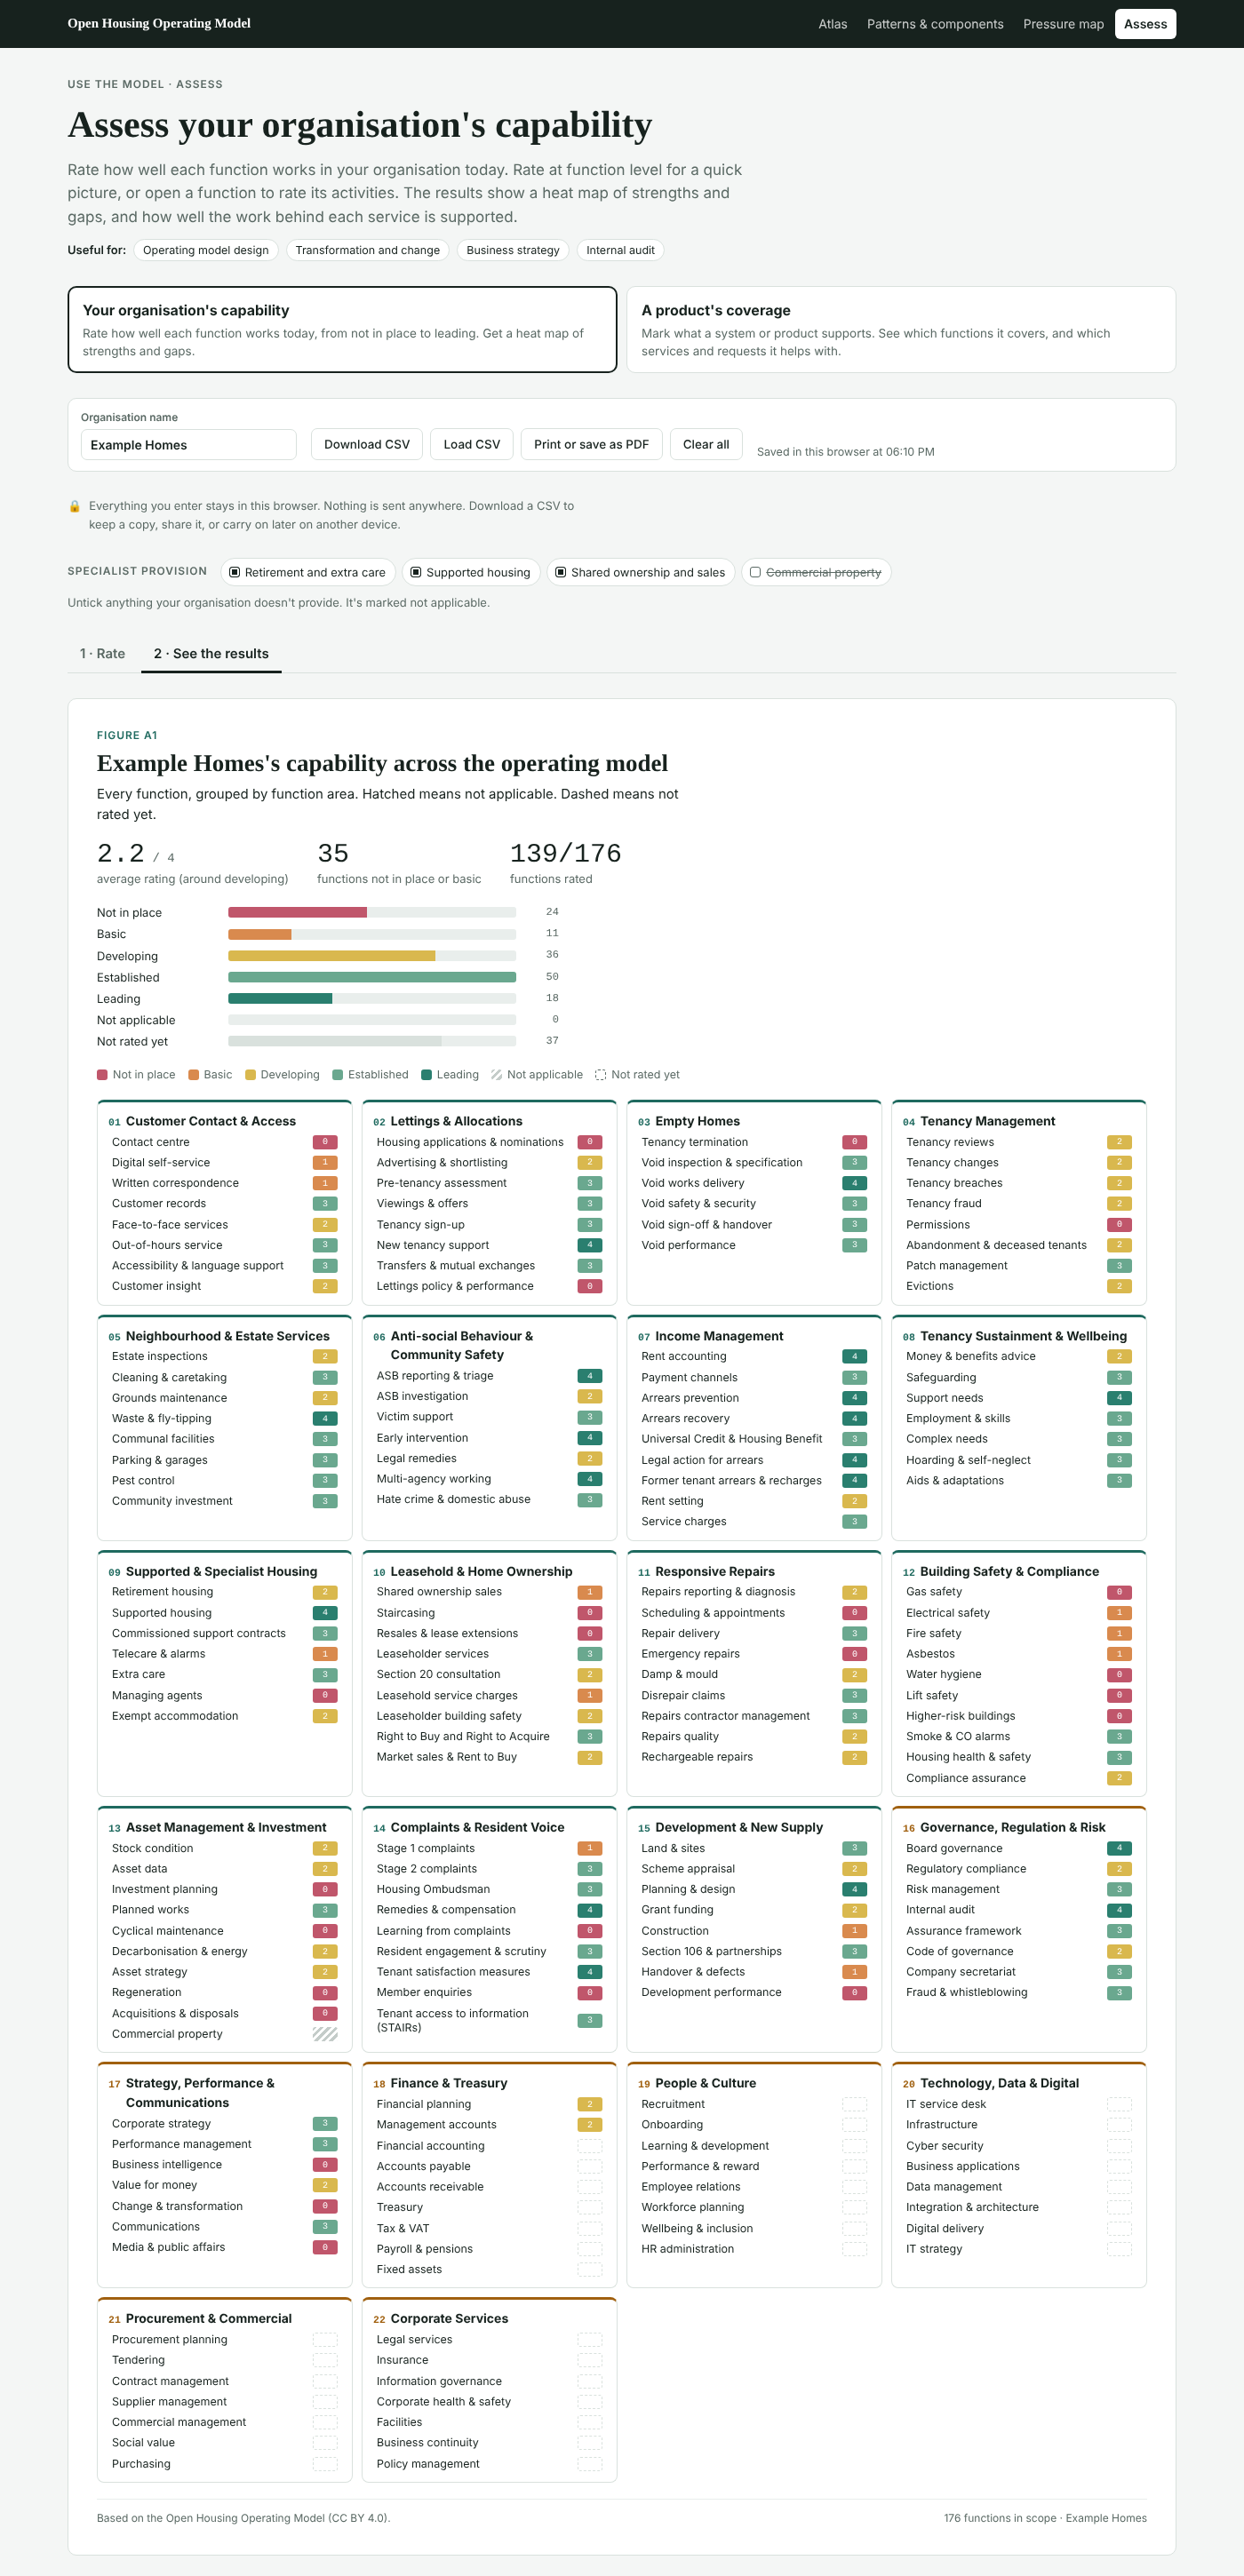
Either way, you get two views of the results.
A heat map of every function, grouped by area. It's the classic operating model picture, but built on a shared, open structure rather than one drawn up from scratch.
How well the work behind each service is supported. This is the bit I'm most pleased with. Because every request in the model is linked to the activities behind it, your ratings roll up to the services residents actually use.
You might rate your contact centre as established and your repairs scheduling as basic. The tool then shows that "Repair my home" is only as strong as its weakest part. For a product, it gives you a headline like "fully supports X of the 106 resident requests, and helps with Y more".
That's useful whichever side of the table you're on:
- Suppliers can show what their product genuinely covers, in a structure everyone shares.
- Buyers can compare products like for like, and see the gaps any one of them would leave.
Everything you enter stays in your browser. Nothing is uploaded. You can download your assessment as a spreadsheet to keep, share or carry on with later, and print the results or save them as a PDF.
Also new: not everyone does everything
Thanks to Anchor Housing, who shared their customer journey catalogue, the model has 17 new requests. They range from checking on a housing application to getting help if you're facing eviction.
Anchor's work also raised a good point. Not every housing association provides retirement housing, extra care or supported housing. So those parts of the model, plus shared ownership and commercial property, are now marked as specialist provision. In the atlas, and in the assessment, you can switch off what your organisation doesn't do.
The usual caveats
The components, like everything else in the model, are judgements about a typical association. Which requests need which building blocks is open to debate, and I'd welcome the debate.
The pressure map inherits the caveats of the layers behind it. The regulation layer isn't legal advice. The AI layer is an opinion, not a compliance assessment.
And an assessment is only as good as the honesty of the people filling it in.
Try them
As ever, it's all open, on GitHub, under a Creative Commons licence.
I'd especially love to hear from:
- Digital and product people. Are these the right 15 components? What's missing?
- Anyone who runs an assessment. What was useful? What was confusing? And would you be willing to share what you learned?
- Suppliers. Would you map your product against the model and publish the result? An open, comparable picture of what housing systems actually cover would be good for everyone, buyers most of all.
Tell me what you'd want next. What i think would be good is to iterate on the product assessement to allow users to add multiple products in to the assessment.